Singapore MRT/LRT in 2040
Tingfeng 11 min read August 15, 2024 [General] #mrt #lrt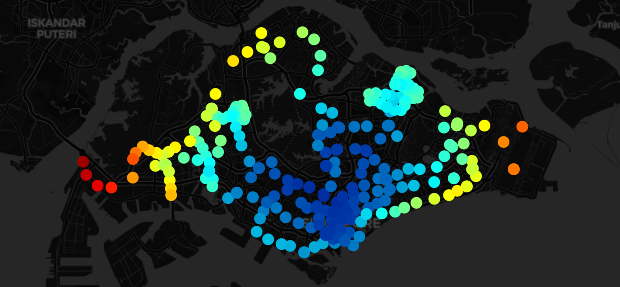
Expansion of the MRT/LRT rail network is a major part of the Singapore Land Transport Master Plan 2040. As the rail network would be over half a century old by then, I wanted to take a look at how its fastest available routes have changed in the past, and how we can expect them to change in the future. So here is a program to calculate the fastest path between any 2 train stations, similar to the countless travel mobile apps out there, but for all known and projected stages, from the initial launch in year 1987 to 2040 and beyond.
In addition to travel time, you can specify unique dwell times and transfer times for every segment between stations, as well as conditional transfers like at the Bahar Junction MRT station. Walkable routes between nearby stations are also supported.
If you have better time estimates, especially for future lines, you can customize all these variables via configuration files. Everything is available under a permissive license at this repository.
Rail Network Metrics
With all fastest paths, we can rank the stations using network centrality metrics like degree, betweenness, and closeness.
However, these centrality metrics do not give us information about changes in a station's fastest routes in terms of raw distance and travel time, which is what commuters care about. So instead, we shall use the following metrics.
Fastest Path Length
Length of the fastest path between 2 stations. Depending on factors like train speeds, dwell times, and transfer times, the fastest path may not always be the path with the smallest possible distance. A station's mean fastest path length to all other stations can be used to gauge its connectivity in terms of raw distance to other stations. To keep things concise, let us call it "FPL" (fastest path length) from now on.
Circuity
The circuity between any 2 stations is the FPL divided by the direct great-circle distance (or haversine distance) between them. If the circuity between 2 stations is high, it may be faster to take alternative transport like a public bus, or even walk. A station's mean circuity to all other stations can be used to gauge its connectivity in terms of how direct its paths are to other stations.
Past, Present, And Future
Let us compare historic and projected changes in fastest routes across stations and regions of Singapore, from year 2003 to year 2040.
If you are on a mobile device, I recommend rotating your device to landscape orientation to view the scatter plots.
The stages are:
- North East Line launch (20 June 2003)
- Punggol LRT East Loop and Sengkang LRT West Loop (29 January 2005)
- Downtown Line 2 (27 December 2015)
- Teck Lee LRT Opening (15 August 2024)
- Changi Airport Branch Conversion (2040)
Mean Fastest Path Length
In the mid-noughties, the mean FPL is low in the Central Region, and high everywhere else. The further you are from the city centre where most stations are concentrated at, the longer the fastest paths.
By 2015, the newer medium capacity lines (Circle Line and Downtown Line) have significantly reduced the mean FPL for the Bukit Panjang, Sengkang, Punggol, Tampines and Pasir Ris planning areas.
In 2040, we can expect the biggest improvements to be at the Tuas, Choa Chu Kang, Sungei Kadut, Woodlands, Bedok, and Pasir Ris planning areas.
Note: Data for Cross Island Line 3 is not included as it is still under engineering studies.
The North Region
Historically the North Region has received fewer upgrades than other Regions. In fact, almost no rail expansion projects have been announced for this Region in the next 16 years, with the exception of Sungei Kadut MRT Station (mid 2030s), and the Johor Bahru-Singapore Rapid Transit System in 2026.
Mean Circuity
In 2003 the mean circuity was highest in the North-East Region and at all LRT lines; the average distance from stations in these areas to all other stations is about twice that of the direct distance. Despite being located in the Central Region, the mean circuity for Bishan, Braddell, and Toa Payoh was very close to 2 as well.
By 2015, the newer medium capacity lines have helped to keep the mean circuity of all stations under 2.
High Circuity At Marine Parade
In 2024, the stations with the worst mean circuity are from the North-East Region and among the TEL4 stations along the East Coast.
Without using feeder bus services, commuters taking public transport along the East Coast will have to head all the way to the city centre at Marina Bay just to access the rest of the network.
This contributes to the high circuity of the TEL4 stations despite their proximity to the city centre, especially for trips to stations of other lines in the East and North-East Regions.
Tip: The Tanjong Rhu and Stadium MRT stations are within walking distance, and the grace period for indirect transfers between different lines is 15 minutes. Perhaps the grace period should be increased?
By 2040, the Cross Island Line will help to lower the mean circuity of the North-East Region stations closer towards the national average of 1.42. We can see there are small pockets of high circuity remaining in the Bukit Batok, Choa Chu Kang, Ang Mo Kio, Toa Payoh, Sengkang, Marine Parade, and Bedok areas. Even after addition of the Downtown Line Extension, which provides direct access to Expo station, the TEL4 stations along the Marine Parade and Bedok areas will still have the highest circuity.
Planning Areas and Regions
In these charts, stations are grouped by planning area, and colour coded by Region.
Teck Lee LRT Opening
Changi Airport Branch Conversion
Central Region Versus Everything Else
In both 2024 and 2040, we can see a distinct gap between the Central Region and the other Regions. As expected, all the Central Region planning areas (except for Marine Parade and Marina East) are in the bottom left corner, with low mean FPL (less than 15km) and low mean circuity. As we move away from the city centre, the mean FPL and mean circuity increases. However once we reach the other Regions, the mean circuity begins to decrease instead.
This is a by-product of the Singapore rail network's circle-radial topology, where stations at the outskirts of the city like the Tuas area have long, direct, radial routes to the city centre, so we should not rely only on circuity to gauge the connectivity of a station; a station can have low circuity but also be far from everywhere else.
Future Lines
From 2024 to 2040, the Central and North Region stations will see little improvement. The most drastic changes can be seen from stations in the East and North-East Region. In the West Region, only the Clementi and Jurong East planning areas will see major improvement. These can be attributed to the Cross Island Line.
Possibly due to its localised layout, which resembles an LRT line more than an MRT line, the Jurong Region Line appears to have little impact on the mean FPL and mean circuity of nearby existing North South Line and East West Line stations.
Comparing Older Stations From 2003 And Earlier
One downside of including new stations when comparing mean FPL and mean circuity across different years, is that it is possible for new stations to skew an old station's scores without significantly changing its connectivity to other old stations.
This can be observed in the transition from 2003 to 2005 when the addition of new LRT stations improved the scores of the Sengkang and Punggol MRT stations, and worsened the scores of some North South Line stations, even though their travel distances to other MRT stations did not change.
This time we will look at the mean FPL and circuity for stations opened in 2003 and earlier; only the old North South Line, East West Line, North East Line, and older LRT stations are considered. Any newer stations or lines will be treated as stationless bridges.
NOTE: The colour bar scale for the next 2 charts is slightly different from the previous charts.
Mean Fastest Path Length (Older Stations)
We can see a drastic improvement between 2005 and 2015 for all regions except the West Region. In contrast, from 2015 to 2040, we get marginal improvement, mostly at stations with interchanges to the new Jurong Region Line and Cross Island Line.
Mean Circuity (Older Stations)
Similar pattern as mean FPL. The pockets of high mean circuity at the Choa Chu Kang, Bukit Panjang, and Toa Payoh areas have remained mostly unchanged by developments between 2015 and 2040.
Other Observations
Here are interactive scatter plots for all stages from 1987 to 2040+. As there are many stages, I am using a mapless plot due to this rendering bug in plotly.
East Versus West
Over the past 37 years, there has been greater priority on rail expansion in the Central, East, and North-East Regions than in the West and North Regions. Even though the Jurong Region Line will be the main highlight of the next 5 years, most attention will be shifted back to the East again in the 2030s for the early phases of the Cross Island Line.
Limitations Of Overall Metrics
The mean FPL and mean circuity metrics measure a station's overall connectivity to every other station on the network. Depending on a commuter's travel habits, some stations may be less relevant. For example, the FPL and circuity to Jurong Region Line stations would mean little to a person who lives and works in the North-East Region.
The Jurong Region Line Is Different
The Jurong Region Line's localised LRT-like layout makes it less effective at improving FPL and circuity of existing lines, like the Downtown Line did for the Bukit Panjang LRT Line in December 2015. As its name implies, this line appears to prioritise more on improving connectivity within a single Region, unlike the other MRT lines which span across multiple Regions.
North Coast Plan, East Coast Plan
This leaves us with the North Region, which is the smallest Region in terms of population and population density. The Land Transport Authority is currently conducting feasibility studies for a new line that would stretch from Woodlands, Sembawang, Sengkang, Serangoon North, Whampoa, Kallang and the Greater Southern Waterfront. This new line could reduce the above-average FPL and circuity of both the North Region and East Coast stations.
Moving Forward
By looking at only the fastest path length and circuity metrics, we can see that there are sections of the MRT/LRT network along the outer edges of the Central Region that may have less than optimal connectivity even in 2040. However, rail connectivity encompasses more than just these 2 factors, like real passenger usage patterns, and the fact that the MRT/LRT system is complemented by the public bus system.
The mean circuity of stations in most non-Central Regions are comparable to stations in the Central Region; low and close to the ideal value of 1. This implies a practical limit on how far we can reduce mean travel distances by adding more direct rail connections. New developments that aim to de-centralise the city centre may make this less of a concern by reducing the need for residents to commute out of their Region.